Overview
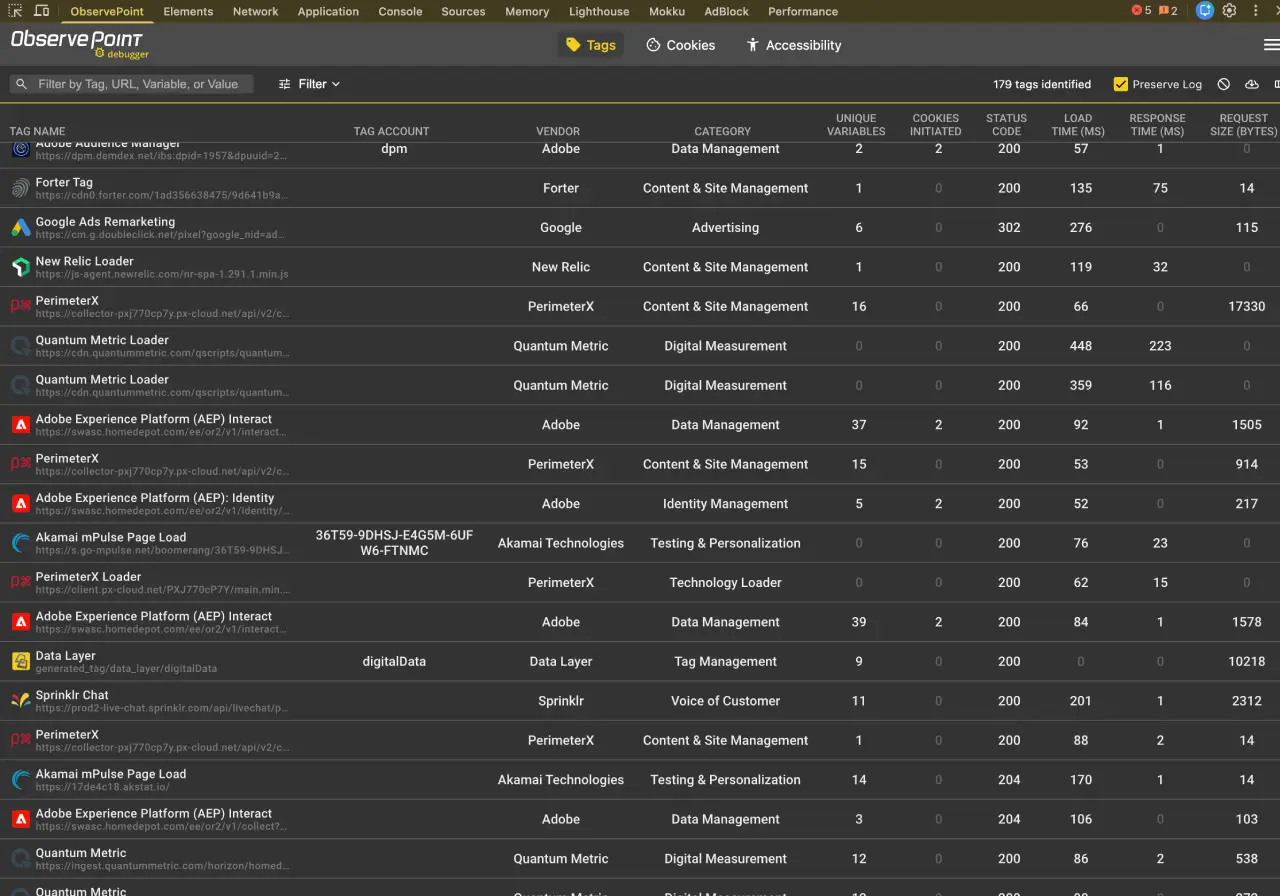
ObservePoint Tag Debugger is a Chrome Manifest V3 extension that gives analysts a live debugging view into any website’s marketing and analytics stack. The extension adds a custom DevTools panel (built with Angular 19) that captures network requests as they fire and presents them in a sortable, filterable table with expandable detail views for variables, request URLs, and cookies set on each request.
The panel covers three core areas: a Tags view showing all intercepted network beacons identified against a vendor database (Adobe Analytics, Google Analytics, New Relic, and dozens more), a Cookies view with bulk-action controls and advanced filtering, and an Accessibility view powered by axe-core.
The front end was built from the ground up as a standalone Angular app bundled separately from the Webpack-compiled background and content scripts. A shared XLSX export pipeline lets users download tag inventories, variable dumps, and cookie data into structured spreadsheets.
A lightweight serverless API running as a CloudFront origin-request Lambda handles tag identification — the background script batches intercepted requests and POSTs them to the API, which matches URLs against an embedded vendor signature database and returns parsed variable data back to the panel.
You can install the ObservePoint Debugger by clicking here.
Why it's notable
The UI handles a genuinely complex data model in real time. Each intercepted request can carry dozens of parsed variables (decoded from query strings, POST bodies, or proprietary encoding schemes), and the interface needed to stay fast and responsive while new requests streamed in continuously during a page load.
Notable front-end work includes a fully interactive filter system with chip-based multi-select menus, column visibility controls, an expansion panel with tabbed detail views, and a control bar with persistent-state toggles. The export pipeline handles Excel’s 32,767-character cell limit gracefully and generates multi-sheet workbooks from a single action.
On the infrastructure side, owning the full deployment path — from TypeScript Lambda code through Terraform-managed CloudFront distributions — provided end-to-end visibility into how the extension’s data pipeline actually works at scale.
Unique challenges
Chrome Manifest V3 significantly restricts what background service workers can do — they’re no longer persistent, can’t use XMLHttpRequest, and have strict limitations on cross-origin communication. Designing the request capture pipeline required careful orchestration between the background worker, content scripts (in both isolated and MAIN world contexts), and the DevTools panel, all communicating through Chrome’s message passing APIs.
Tag identification required handling vendor-specific encoding quirks: New Relic POST bodies use a proprietary format, some vendors encrypt POST payloads, and Adobe Analytics has edge cases in how variables are named and grouped. The Lambda-side matcher handles all of this before the results ever reach the UI.
Migrating the build system away from Nx mid-project — while keeping four separate build targets (popup, DevTools panel, background script, content scripts) working in parallel — required rebuilding the tooling with a custom run-build.js orchestration script and a restructured angular.json without disrupting active development.
 Web Apps